
Publisher Market Shares: December 2010
DC Comics was the leading publisher in Retail Dollar Shares, while rival Marvel Comics was the leading publisher in Unit Market Share based on total sales of comics, graphic novels and magazines to comic book specialty stores in December 2010, according to Diamond Comic Distributors. Additionally, comic book sales were up 2.58% and graphic novel sales were up 5.76% over November.
PUBLISHER MARKET SHARES
Based on Total Unit Sales of Products Invoiced in December 2010
| PUBLISHER |
DOLLAR MARKET SHARE |
UNIT MARKET SHARE |
|---|---|---|
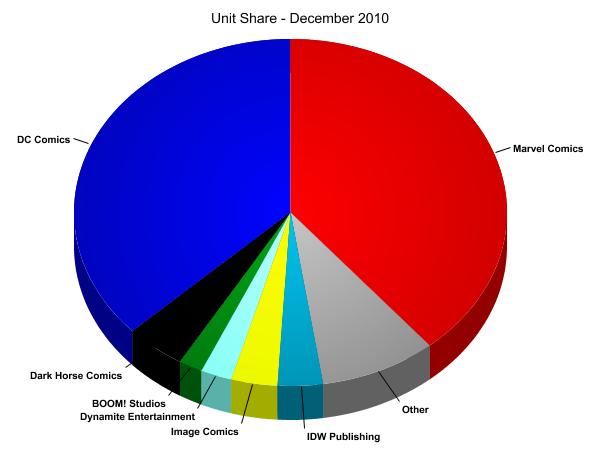
| DC COMICS | 33.07% | 36.99% |
| MARVEL COMICS | 32.28% | 38.90% |
| DARK HORSE COMICS | 5.77% | 4.49% |
| IMAGE COMICS | 5.22% | 3.44% |
| IDW PUBLISHING | 4.15% | 3.38% |
| DYNAMITE ENTERTAINMENT | 2.75% | 2.33% |
| BOOM! STUDIOS | 1.95% | 1.79% |
| EAGLEMOSS PUBLICATIONS LTD | 1.47% | 0.34% |
| VIZ MEDIA | 1.33% | 0.66% |
| AVATAR PRESS | 1.04% | 1.02% |
| ZENESCOPE ENTERTAINMENT INC | 0.91% | 0.86% |
| ARCHIE COMIC PUBLICATIONS | 0.67% | 0.85% |
| UDON ENTERTAINMENT CORP | 0.62% | 0.11% |
| FANTAGRAPHICS BOOKS | 0.61% | 0.09% |
| TOKYOPOP | 0.58% | 0.44% |
| WIZARD ENTERTAINMENT | 0.54% | 0.47% |
| ONI PRESS INC. | 0.42% | 0.19% |
| HUMANOIDS INC | 0.37% | 0.04% |
| ARCHAIA ENTERTAINMENT LLC | 0.35% | 0.27% |
| HACHETTE BOOK GROUP USA | 0.32% | 0.12% |
| OTHER NON-TOP 20 | 5.58% | 3.20% |

|
|
Dollar Market Share – December 2010 |
|
|
Unit Market Share– December 2010 |
COMPARATIVE SALES STATISTICS
| DOLLARS | UNITS | |
|---|---|---|
| VERSUS LAST MONTH | ||
| COMICS | 2.58% | 2.89% |
| GRAPHIC NOVELS | 5.76% | 2.05% |
| TOTAL COMICS/GN | 3.67% | 2.81% |
| VERSUS SAME MONTH LY | ||
| COMICS | -7.45% | -10.68% |
| GRAPHIC NOVELS | 26.74% | 26.24% |
| TOTAL COMICS/GN | 2.20% | -8.11% |
| THIS QUARTER TY VERSUS LAST QUARTER TY | ||
| COMICS | -1.89% | -4.39% |
| GRAPHIC NOVELS | 3.35% | 6.24% |
| TOTAL COMICS/GN | -0.16% | -3.45% |
| THIS QUARTER TY VERSUS THIS QUARTER LY | ||
| COMICS | -4.72% | -8.72% |
| GRAPHIC NOVELS | 16.96% | 23.27% |
| TOTAL COMICS/GN | 1.74% | -6.36% |
| VERSUS LAST YEAR | ||
| COMICS | -4.65% | -5.91% |
| GRAPHIC NOVELS | -1.02% | -1.52% |
| TOTAL COMICS/GN | -3.48% | -5.54% |
This information may not be reproduced in any format without the express permission of Diamond Comic Distributors.
How does Diamond calculate the charts? It all starts at the comic book shop.
Data for Diamond’s sales charts – which include the monthly market shares and all top product charts – are compiled by Diamond Comic Distributors from a universe of over 3,500 accounts, comprised of comic book specialty shops and other merchant stores and buyers. The shops are primarily located in North America, with a percentage of sales also to international stores and buyers located throughout the world. The account base includes not only brick-and-mortar comic book specialty shops, but also Internet stores, chain stores, and other specialty stores.
Unit and Retail Dollar sales are calculated based upon orders invoiced and shipped to Diamond accounts during any given month, which comprises initial pre-orders, advance reorders, and reorders, minus any copies that are received back from a title marked as returnable.
