
Publisher Market Shares: February 2014
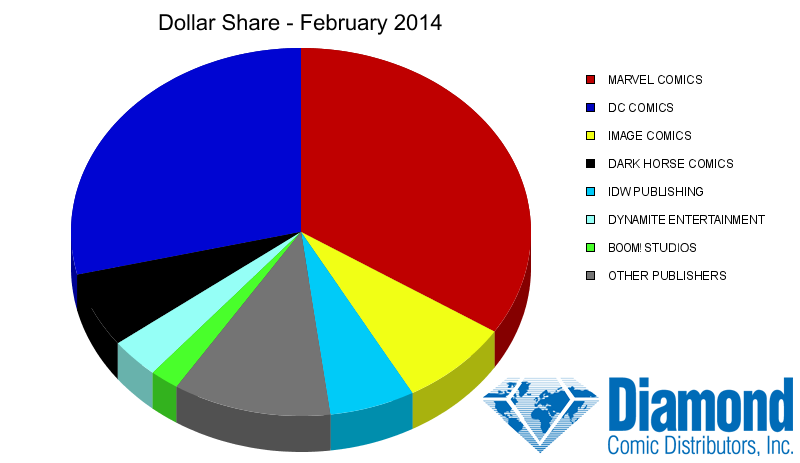
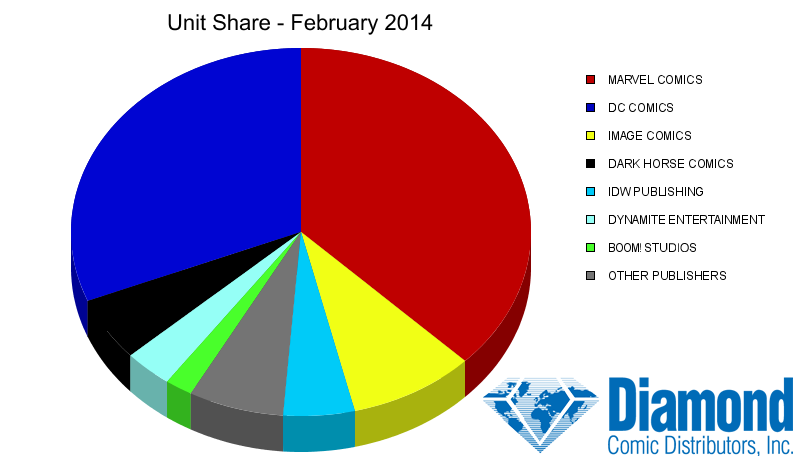
Marvel Comics was the leading publisher in Retail Dollar Share and Unit Share categories in February 2014 based on total sales of comics, graphic novels and magazines to comic book specialty stores, according to Diamond Comic Distributors.
PUBLISHER MARKET SHARES
Based on Total Unit Sales of Products Invoiced in February 2014
|
|
|||||||||||||||||||||||||||||||||||||||||||||||||||||||||||||||||||||||||||||||||||||||||||||
NEW TITLES SHIPPED
Based on Total Unit Sales of Products Invoiced in February 2014
| PUBLISHER | COMICS SHIPPED | GRAPHIC NOVELS SHIPPED | MAGAZINES SHIPPED | TOTAL SHIPPED |
| DC COMICS | 85 | 26 | 0 | 111 |
| MARVEL COMICS | 69 | 32 | 0 | 101 |
| IMAGE COMICS | 48 | 11 | 0 | 59 |
| DARK HORSE COMICS | 39 | 19 | 0 | 58 |
| DYNAMITE ENTERTAINMENT | 50 | 8 | 0 | 58 |
| IDW PUBLISHING | 40 | 17 | 0 | 57 |
| BOOM ENTERTAINMENT | 24 | 6 | 0 | 30 |
| AVATAR PRESS INC | 10 | 1 | 1 | 12 |
| VALIANT ENTERTAINMENT LLC | 9 | 2 | 0 | 11 |
| EAGLEMOSS | 0 | 0 | 4 | 4 |
| OTHER | 69 | 102 | 20 | 191 |
COMPARATIVE SALES STATISTICS
Based on Total Unit Sales of Products Invoiced in February 2014
| DOLLARS | UNITS | |
| FEBRUARY 2014 VS. JANUARY 2013 | ||
| COMICS | -5.48% | -4.47% |
| GRAPHIC NOVELS | -4.48% | 5.98% |
| TOTAL COMICS/GN | -5.17% | -3.65% |
| FEBRUARY 2014 VS. FEBRUARY 2013 | ||
| COMICS | -10.39% | -14.77% |
| GRAPHIC NOVELS | 2.83% | 14.99% |
| TOTAL COMICS/GN | -6.71% | -12.83% |
| YEAR-TO-DATE 2014 VS. YEAR-TO-DATE 2013 | ||
| COMICS | -5.53% | -11.18% |
| GRAPHIC NOVELS | -6.69% | 3.16% |
| TOTAL COMICS/GN | -5.89% | -10.15% |
 |
|
Dollar Market Share – February 2014 |
 |
|
Unit Market Share– February 2014 |
This information may not be reproduced in any format without the express permission of Diamond Comic Distributors.
How does Diamond calculate the charts? It all starts at the comic book shop.
Data for Diamond’s sales charts – which include the monthly market shares and all top product charts – are compiled by Diamond Comic Distributors from a universe of over 3,500 accounts, comprised of comic book specialty shops and other merchant stores and buyers. The shops are primarily located in North America, with a percentage of sales also to international stores and buyers located throughout the world. The account base includes not only brick-and-mortar comic book specialty shops, but also Internet stores, chain stores, and other specialty stores.
Unit and dollar market shares are calculated based upon orders for comic books, graphic novels, and magazines invoiced and shipped to Diamond accounts during any given month, which comprises initial pre-orders, advance reorders, and reorders, minus any copies that are received back from a title marked as returnable.
The count of new titles shipped includes all titles that were invoiced by Diamond to retailers for the first time during the month and is not the official solicited title count for the month. Variant edition comic books and graphic novels at the same price point count as a single SKU. Variant edition comic books and graphic novels at different price points count as separate SKUs for each edition.
